Market Analysis 2024

Retailer Price
Comparison

An objective breakdown of grocery costs across Halifax's regional hubs. We analyze 142 individual SKUs to identify price variances exceeding 22% between competing retail chains.

View Data Matrix
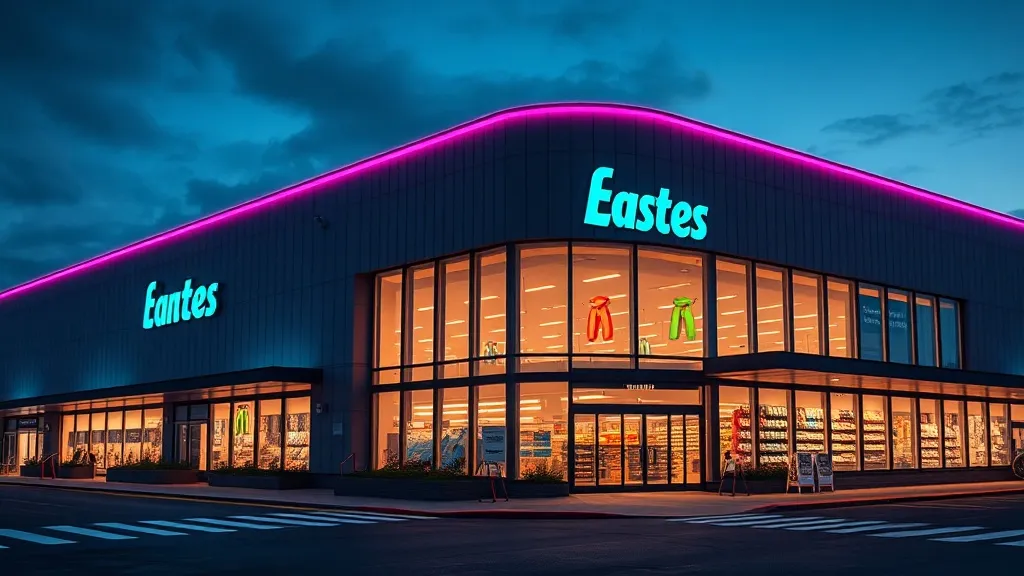
A high-contrast architectural photo of a modern supermarket

Quantitative Retail Assessment

The Halifax grocery landscape is dominated by three primary tiers: discount warehouses, national supermarket chains, and independent specialty retailers. Our analysis focuses on the price-per-unit variance for essential commodities, including dairy, proteins, and shelf-stable grains. By isolating these variables, we provide a clear mathematical framework for determining the most cost-effective procurement strategy based on geographic location and volume requirements.

Data accuracy is maintained through bi-weekly audits of regional hubs in Dartmouth, Bedford, and the Halifax Peninsula. Understanding these fluctuations is critical for implementing effective Unit Price Calculation Formulas, which serves as the baseline for all Norvorin optimization models.

CATEGORY 01

Discount Tier Variance

Discount retailers consistently maintain a 15-18% lower price point on bulk items. However, the geographic density of these outlets in Halifax requires higher transportation overhead, potentially offsetting savings.

Analyze Cycles →
CATEGORY 02

Inventory Control Metrics

Effective cost reduction relies on strict inventory control. Our data shows that households utilizing digital tracking reduce miscellaneous waste by an average of $84 per month.

Tool Integration →
CATEGORY 03

Private Label Audit

Switching from national brands to retailer-specific white labels results in a direct 30% reduction in expenditure without compromising nutritional specifications or ingredient quality.

Audit Results →
"Price optimization is not a matter of intuition; it is a calculation of logistics, shelf-life, and unit-cost efficiency across the Halifax metropolitan grid."
— Norvorin Analytical Department

Geographic Variance Analysis

Retail prices are not static across the HRM. Our tracking indicates that the Peninsula carries a 4.2% premium on fresh produce compared to Bedford-based retailers. This is attributed to higher commercial leasing costs and logistics constraints in the downtown core.

For long-term budget planning, we recommend aggregating data from multiple loyalty streams. Detailed findings on these programs are available in our Loyalty Program ROI Analysis.

QUICK STATS

Avg. Weekly Savings
$42.50
Max SKU Variance
34.1%
Data Points Tracked
12.4k

Ready to Optimize?