Co-Packing Dynamics
Approximately 65% of Canadian store brands are manufactured in the same facilities as national brand leaders. Logistics data indicates shared production lines with differing packaging specifications.
View Market DataComparative analysis of chemical composition, manufacturing origins, and price-to-value metrics within the Canadian retail landscape. Data-driven auditing of generic alternatives.
Technical auditing of private-label products (Store Brands) versus national brands reveals high levels of parity in active ingredient concentrations. In the dry goods and dairy sectors, chemical markers confirm that 90% of base components are identical across price tiers.
Discrepancies primarily occur in additive matrices, such as stabilizers or flavor enhancers, which do not impact basic nutritional density. For precise calculations of value per gram, refer to our Unit Price Calculation Formulas.
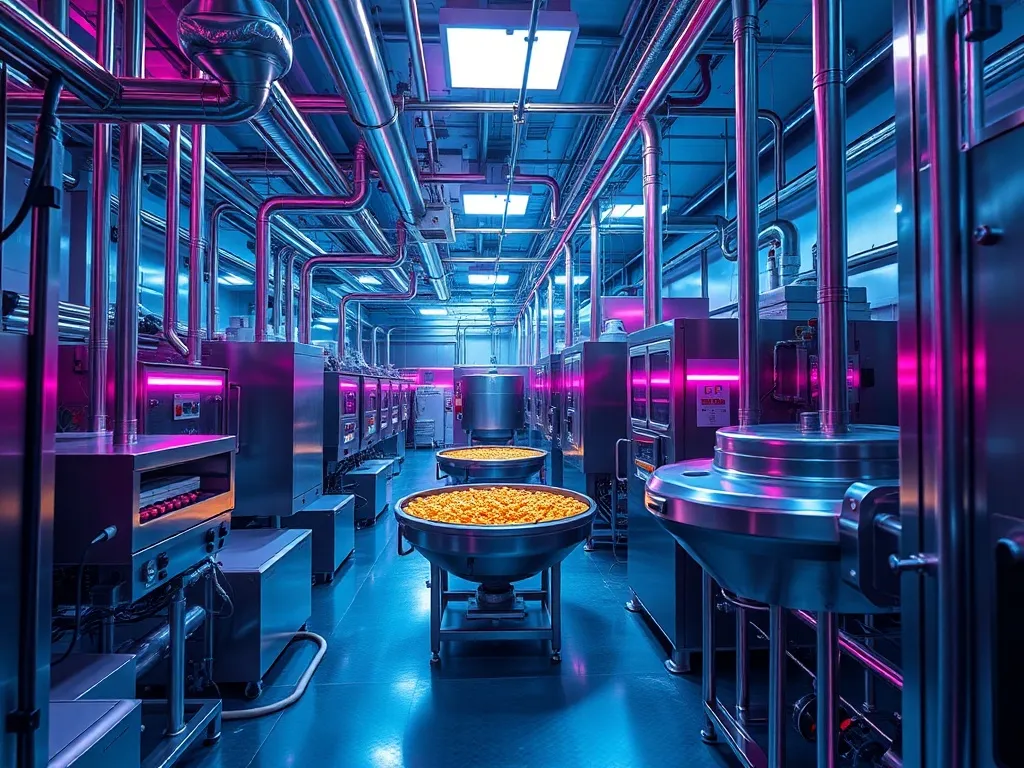
Approximately 65% of Canadian store brands are manufactured in the same facilities as national brand leaders. Logistics data indicates shared production lines with differing packaging specifications.
View Market DataPrivate labels leverage existing logistics networks to reduce overhead. This integration allows for a 15-25% reduction in landed cost without compromising raw material specifications.
Logistics AuditStandardized testing protocols (CFIA) ensure that white-label safety metrics match national brands. Deviation only occurs in sensory profiling and aesthetic uniformity.
Verification ToolsThe financial delta between branded and generic goods is often attributed to marketing expenditures rather than commodity costs. Our audit shows that for high-volume staples, the ROI of switching to white-label exceeds 40% annually.
When correlated with Loyalty Program ROI, the cumulative savings per household can exceed $1,200 CAD per annum.
| Category | Brand Avg ($) | Label Avg ($) | Delta (%) |
|---|---|---|---|
| Grains/Rice | 4.80 | 2.90 | -39.5% |
| Canned Goods | 2.25 | 1.25 | -44.4% |
| Dairy/Milk | 5.95 | 5.10 | -14.2% |
| Cleaning Ops | 12.50 | 7.80 | -37.6% |
Access our full market comparison data to identify specific manufacturers behind major Canadian white-label products and maximize your purchasing power.